Energy poverty is a widespread problem and also affects high-income countries in Western Europe, such as the Netherlands. Energy poverty is a pressing problem there, which is why local measures are being taken to combat it.
In the Netherlands, approximately 550,000 households live in energy poverty (out of a total of 8 million households). They spend more than 10% of their disposable income per month on paying the energy bill or have too little left after paying the necessary expenses to get by. This is about 7% of households. In Eindhoven, where EnergyMeasures aims to tackle energy poverty, approximately 11,000 households are counted as minimum incomes (out of a total of approximately 112,000 households). Not all of these households live in energy poverty but they have to get by with minimal means. Depending on the calculation method, the number of households in Eindhoven living in energy poverty is approximately 11%.
EnergyMeasures attracts households with the support of local authorities
In Eindhoven, the name of the EnergyMeasures project is ‘Energiebox Plus’. The Municipality of Eindhoven works closely with Energiebox, a NGO that allows energy coaches to visit households for a one-off conversation about energy consumption, where the household receives a box with energy-saving products. Energiebox Plus focuses on households that live in energy poverty. Specially trained energy coaches enter into a trajectory for a year with a household that is dealing with energy poverty (or that is at risk of getting into trouble). They do not visit once, but keep in touch with the household on a regular basis. If there are any questions about the energy bill or energy consumption, the coach can answer them immediately. But also if there are other issues within a household (loneliness, debts, problems with raising the children), the energy coach can put the household in touch with the right organisations.
The aim is for the household to regain control of its energy bill after a year of supervision, to have more insight into how energy can be saved and, if necessary, to be referred to the right social institution. The goal for Eindhoven is to engage 400 households. By the end of April 2022 250 households have already been reached.
Establishing a baseline
To create a baseline, Energiebox Plus records the meter readings (in both gas and energy consumption) at the start of the process. By doing this again at the end of the process, it will be possible to see how much has been used. This data can be compared with old data for a large proportion of households (those who did not switch to another supplier in the past year). This gives also insight into the savings.
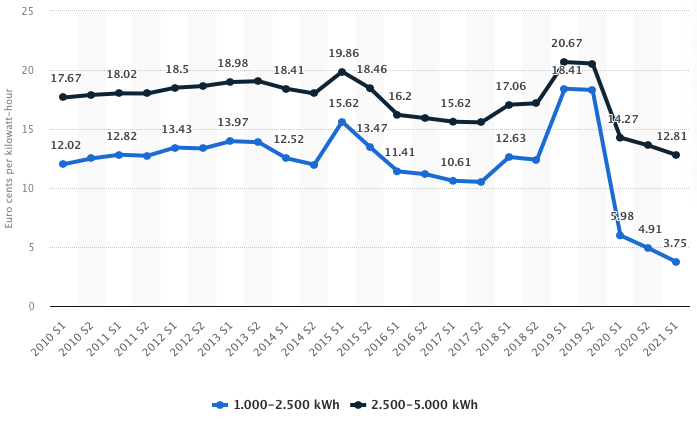
95% of households are connected to the natural gas network and natural gas is supplied to the houses via a supplier, hence almost all households have to deal with an energy supplier. The energy market has been liberated in the Netherlands. Households can choose from which supplier they purchase their energy. There are different types of contracts, all of which have their own terms and conditions. What every energy supplier in the Netherlands has in common is that they offer their customers online insight into the historical energy consumption of the household. In the Netherlands, you can switch from one energy supplier to another every year (at the end of the year). If a household stays with an energy supplier for a number of years as a customer, it is possible to view historical overviews. Everyone has the opportunity to log in to the website of their own energy supplier to view their own consumption per year, month, week, and day. This is possible in KwH as well as in Euros. It is probably not the case that all households with which the energy coaches work have actually created an account and already have insight into this.
Current and future energy data
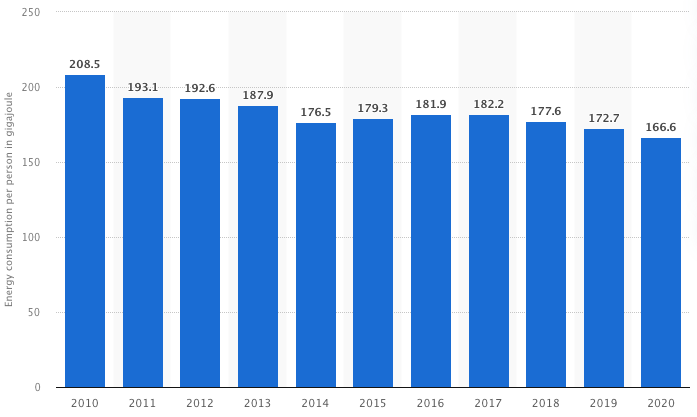
In the Netherlands, approximately 95% of homes are connected to the natural gas network (CBS 2019). A Dutch household consumes about 1500m3 natural gas per year. Most of this consumption, 75%, is used to heat the home. The rest is used for showering/use of hot water (20%) and for cooking (5%). The plan is to phase out natural gas in the Netherlands in the coming decades (until 2050). Firstly, because the Dutch natural gas source in Groningen will run out over time, but more so because the generation of natural gas releases a lot of CO2. Districts and neighbourhoods are therefore gradually being removed from natural gas. The intention is that residents will then heat their homes electrically. A substantial investment is expected from homeowners and housing associations for this, in the form of insulation to the homes. The problem is that not everyone will be able to participate in this. This is certainly not for people with a low income.
Even though energy poverty is a relatively new concept in the Netherlands, the project’s stakeholder interviews show that there is a growing awareness among social housing corporations and the government of the problems resulting from a combination of inefficient buildings (due to age, overdue maintenance), high energy costs and limited financial resources. While there are several programs and schemes that target vulnerable households and energy efficiency improvements, none specifically target energy poverty.
Being dependent on the social housing association and others (for example when people are under financial supervision) increases the feeling of lack of control in those households. According to the interviews with stakeholder organisations, energy-poor households mainly need information and money. Most households do not know what their options are, what types of subsidies they can apply for and how they can reduce their energy bills. (D1.3)
The municipality of Eindhoven also work with the Earn-E, this is a real time meter of the energy consumption. When someone puts the kettle on, for example, the meter starts running and the user can see on his phone how much energy that costs and what the cost is. For Energiebox Plus in Eindhoven, there is a dashboard where the data of all participants with an Earn-E (who have given permission) can be found. So it is possible to see the group savings in kWh for the participants using the Earn-E. There are 200 available for the participants.
Initial analysis for iteration
Due to the war in Ukraine, the prices for natural gas are rising. It means that currently no contracts are being concluded for a fixed prize over a longer period of time. All new contracts are flexible and this means that householders are paying flexible prizes as well. First calculations show that for 60-70% of the households in The Netherlands the energy bill will increase threefold. Therefore it is important to look at energy saving in KwH instead of Euro’s during the project as a means of measuring the effects.
References
Saridaki, M. (2020) Initial report on energy consumption of participating householdsDeliverable D4.1 for the H2020 EnergyMeasures project.
Breukers, S., Van Duren, M., Young, J., VAn de Ven, D., Boekelo, M. (2021) Citizen views on policy needs for energy poverty alleviation. D1.3 for the H2020 EnergyMeasures project.